
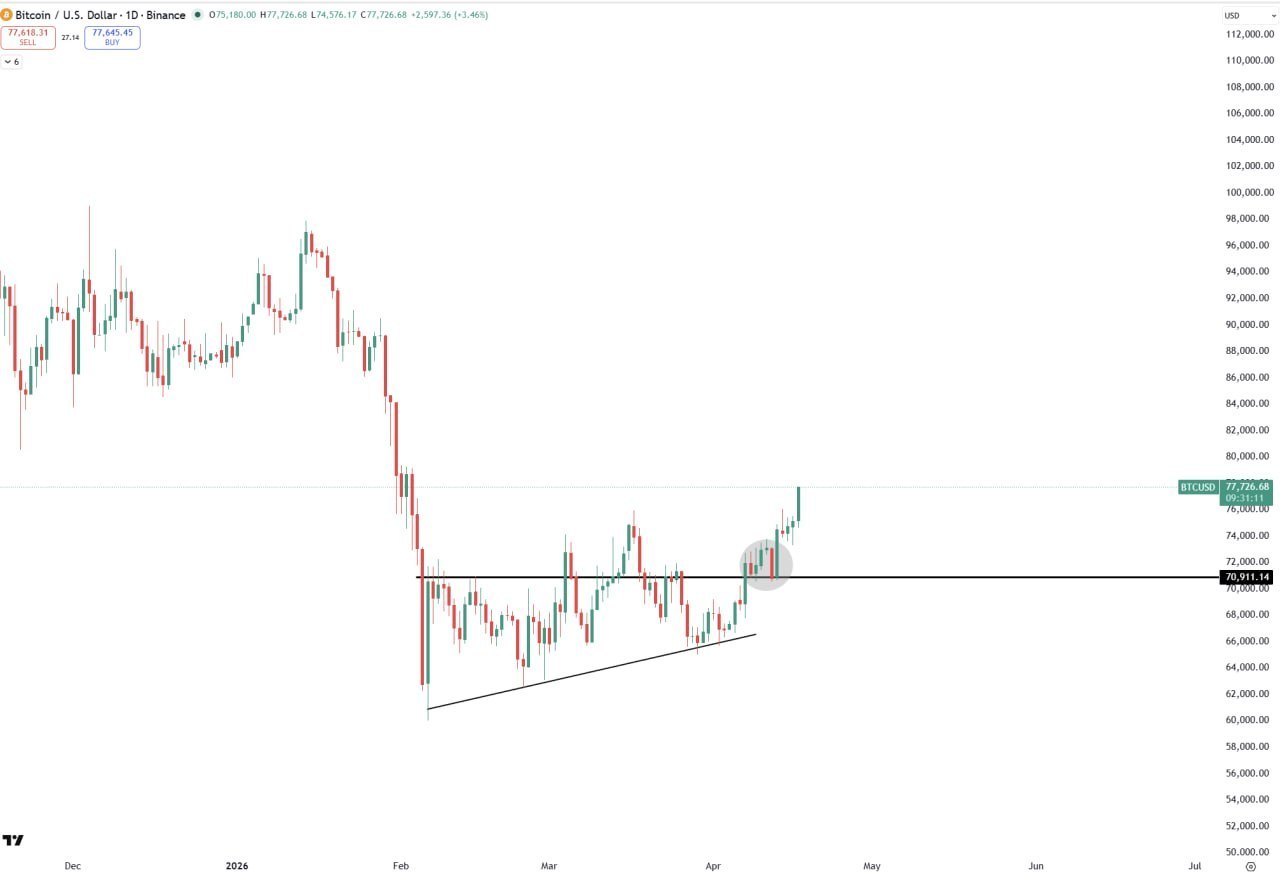
The first image presents a Bitcoin price chart showing a potential bullish breakout after a consolidation phase.
The second image depicts Dogecoin’s price movement, highlighting a bearish trend with a predicted upward movement.
The third image shows an Ethereum chart indicating a potential short position with a specified target area.
The fourth image illustrates the price behavior of a cryptocurrency called ZRO, indicating support and resistance levels.
Leave a Reply