
The first image shows a Dogecoin chart indicating a potential buy setup with a specified target area for price movement.
The second image features an Ethereum chart suggesting a bullish pattern in a price channel, indicating prospects for upward movement.
The third image presents a ZRO chart, indicating levels of interest and potential for future price direction within marked areas.
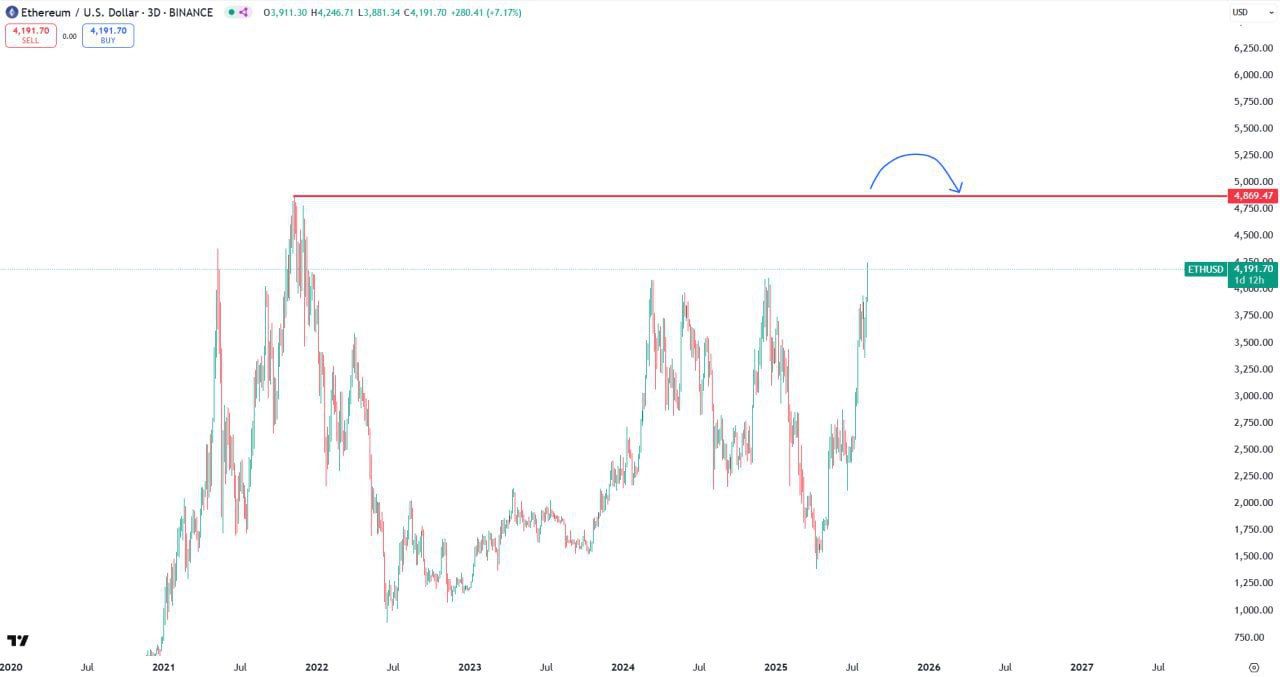
The fourth image shows an Ethereum chart highlighting a significant resistance level, indicating possible price action as it approaches that area.
Leave a Reply