
Image 1: A Dogecoin chart indicating ongoing price action and potential future movement.
Image 2: An Ethereum chart with a pattern and projected price range for potential trading.
Image 3: A ZRO chart highlighting recent trends and possible future price levels.
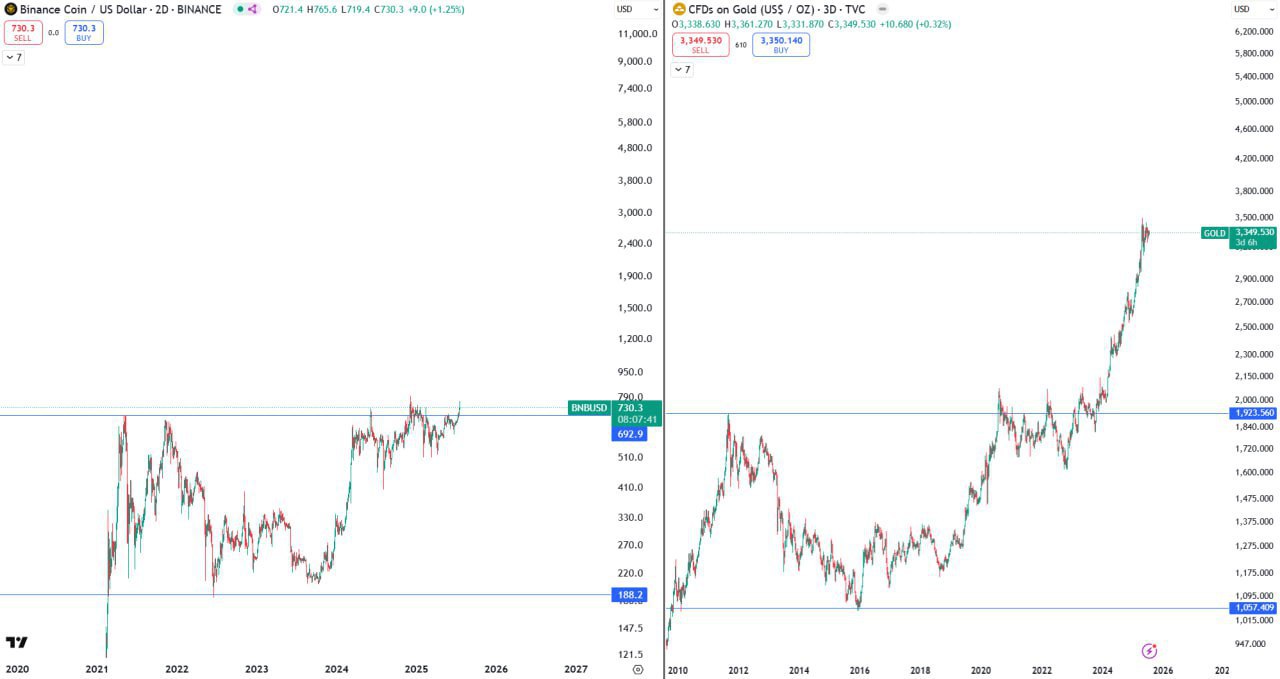
Image 4: A Binance Coin vs Gold price comparison over an extended period, showcasing their relative movements.
Leave a Reply