
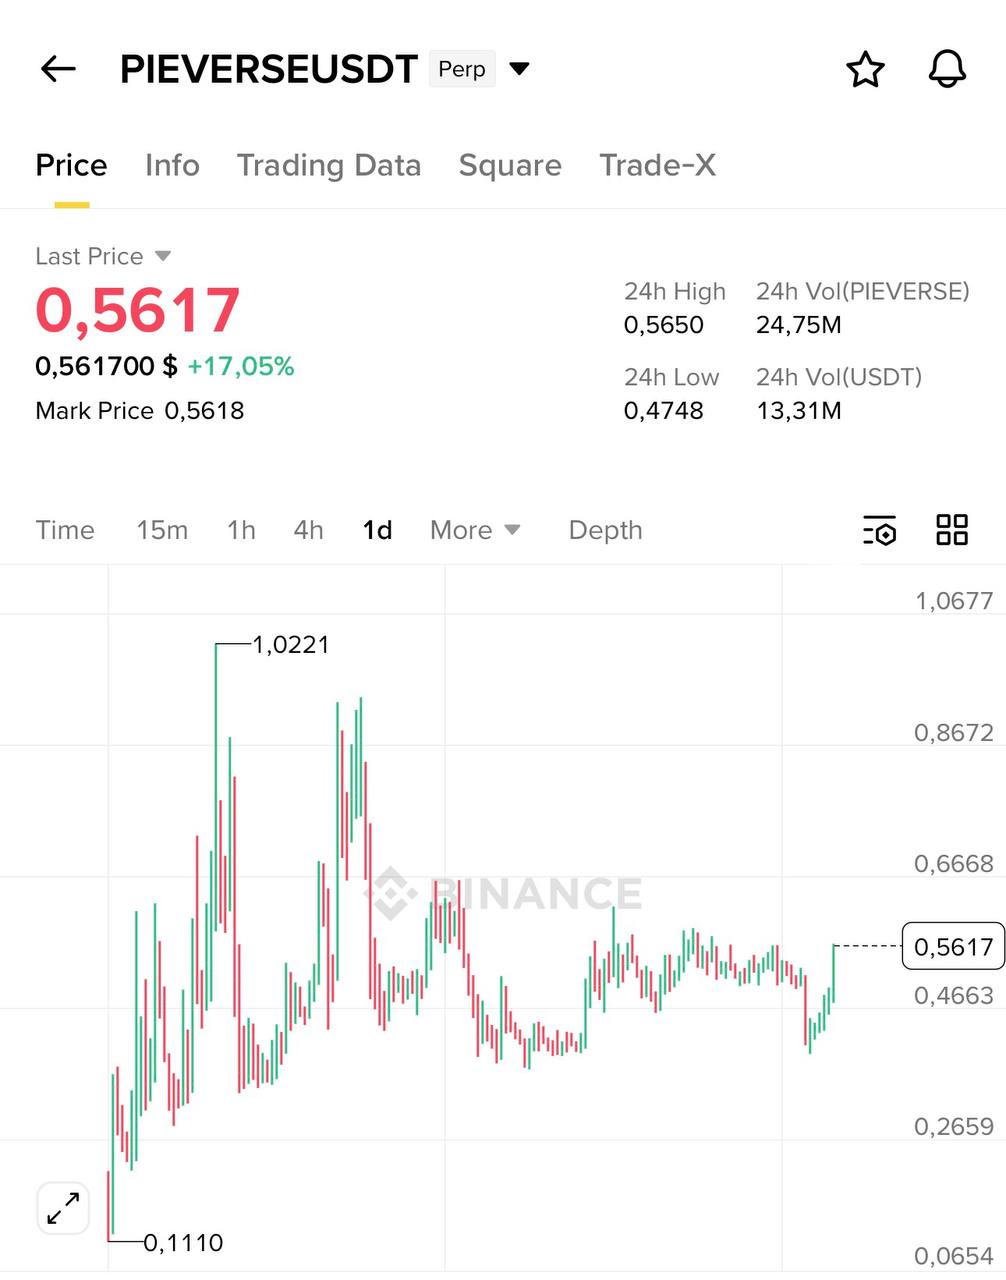
The first image displays a price chart for the cryptocurrency PIEVERSEUSDT, showcasing its last price, 24-hour high and low, and a one-day price movement.
The second image appears to be a trading setup for Dogecoin, indicating market analysis and potential targets within a specified period.
The third image illustrates an Ethereum trading setup, indicating a potential short signal with specific price levels noted for entry and exit.
The fourth image presents a trading setup for ZRO, highlighting growth potential within a defined timeframe.
Overall, these images reflect various cryptocurrency trading setups and market strategies.
Leave a Reply