
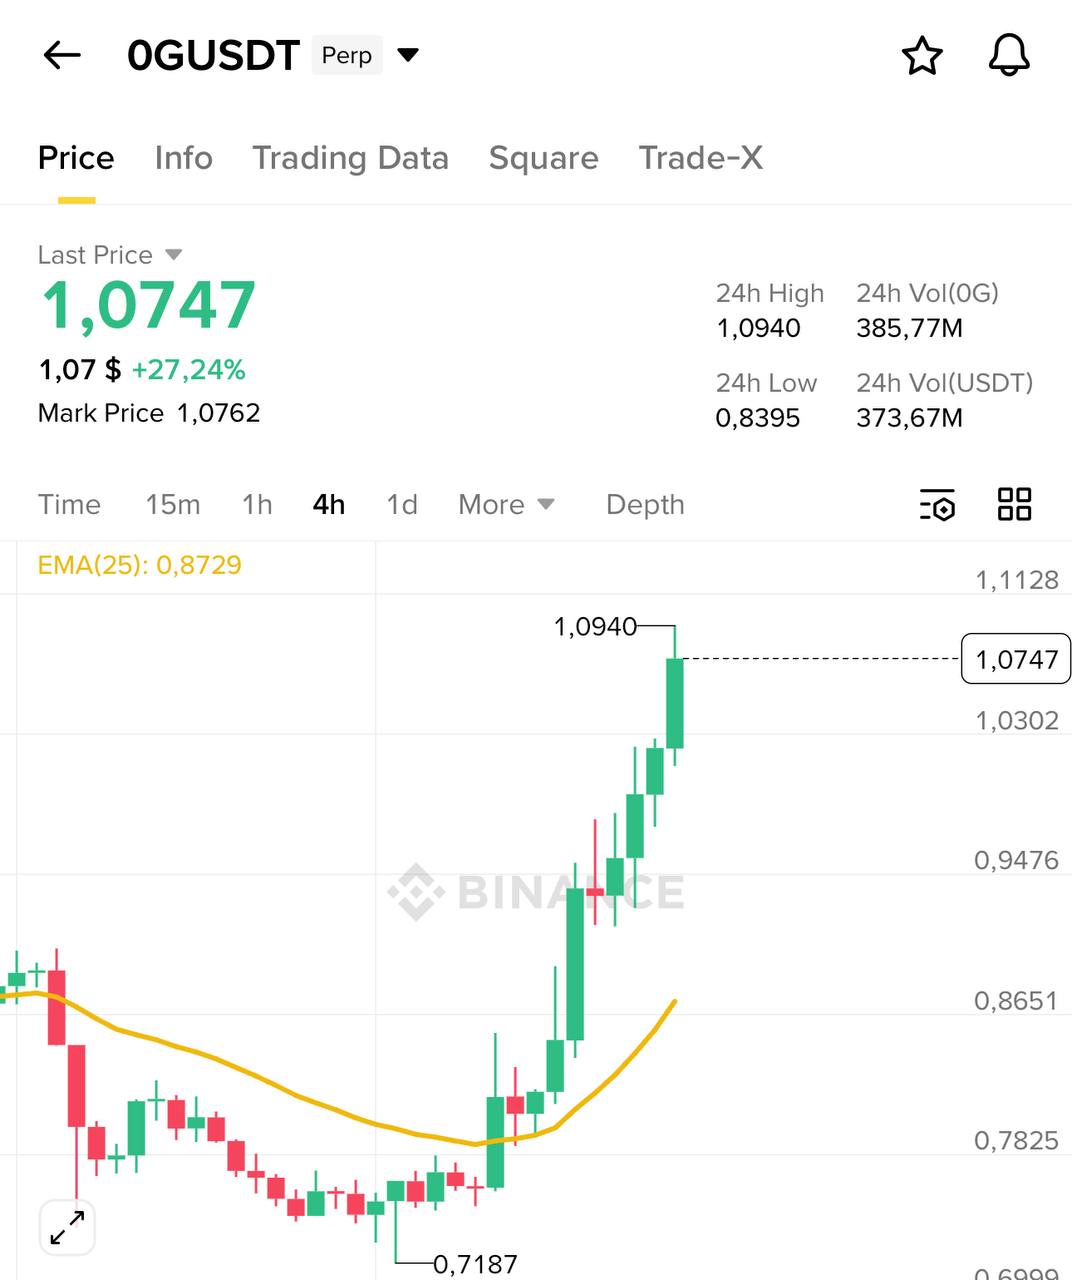
The image shows a trading chart for 0G (OG) with a highlighted bullish trend, indicating a potential upward movement in price. The setup displays a series of higher highs and higher lows, with a clear upward-sloping trendline and a recent breakout above a short-term resistance zone. Volume appears to pick up on the breakout, which can be an early confirmation that buying interest is increasing.
Key observations:
– Higher highs and higher lows forming a bullish structure
– Recent breakout above short-term resistance
– Increased volume at breakout suggesting buyer conviction
This is a chart-based observation and not financial advice. Always do your own research before making trading decisions.
Leave a Reply