
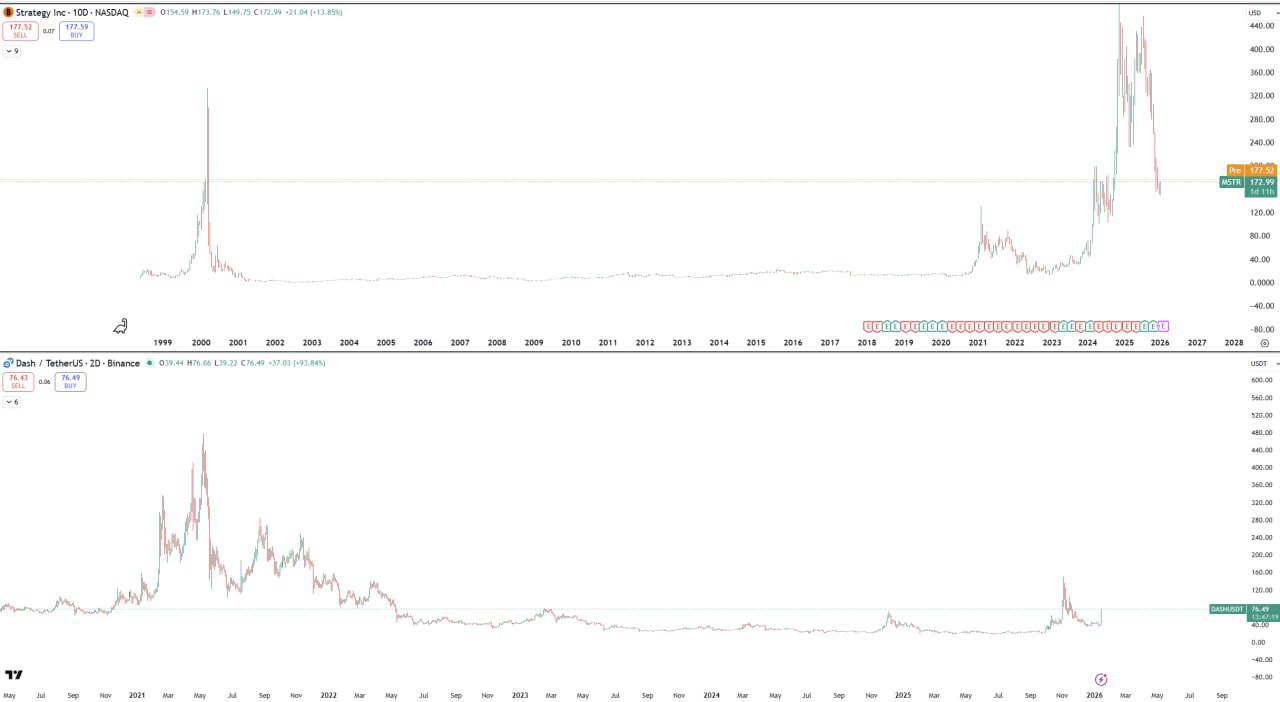
Long-term chart analysis highlights significant historical peaks and drops across major assets. The attached charts show: a multi-year comparison for two assets with clear cycles; a suggested long setup for Dogecoin with defined parameters; a short signal for Ethereum with entry and potential exit points; and a projected long for ZRO with levels of interest.
Key takeaways:
– Long-term trends reveal historical resistance and support levels that remain relevant for future moves.
– Dogecoin shows a potential long setup — consider risk management and defined stop levels before entering.
– Ethereum displays a short signal on the provided chart; monitor confirmations and liquidity zones.
– ZRO appears to have a bullish projection with marked interest zones for entries and targets.
If you want to discuss these setups, charts, or trading approaches, join the conversation in our Telegram channel.
Leave a Reply