
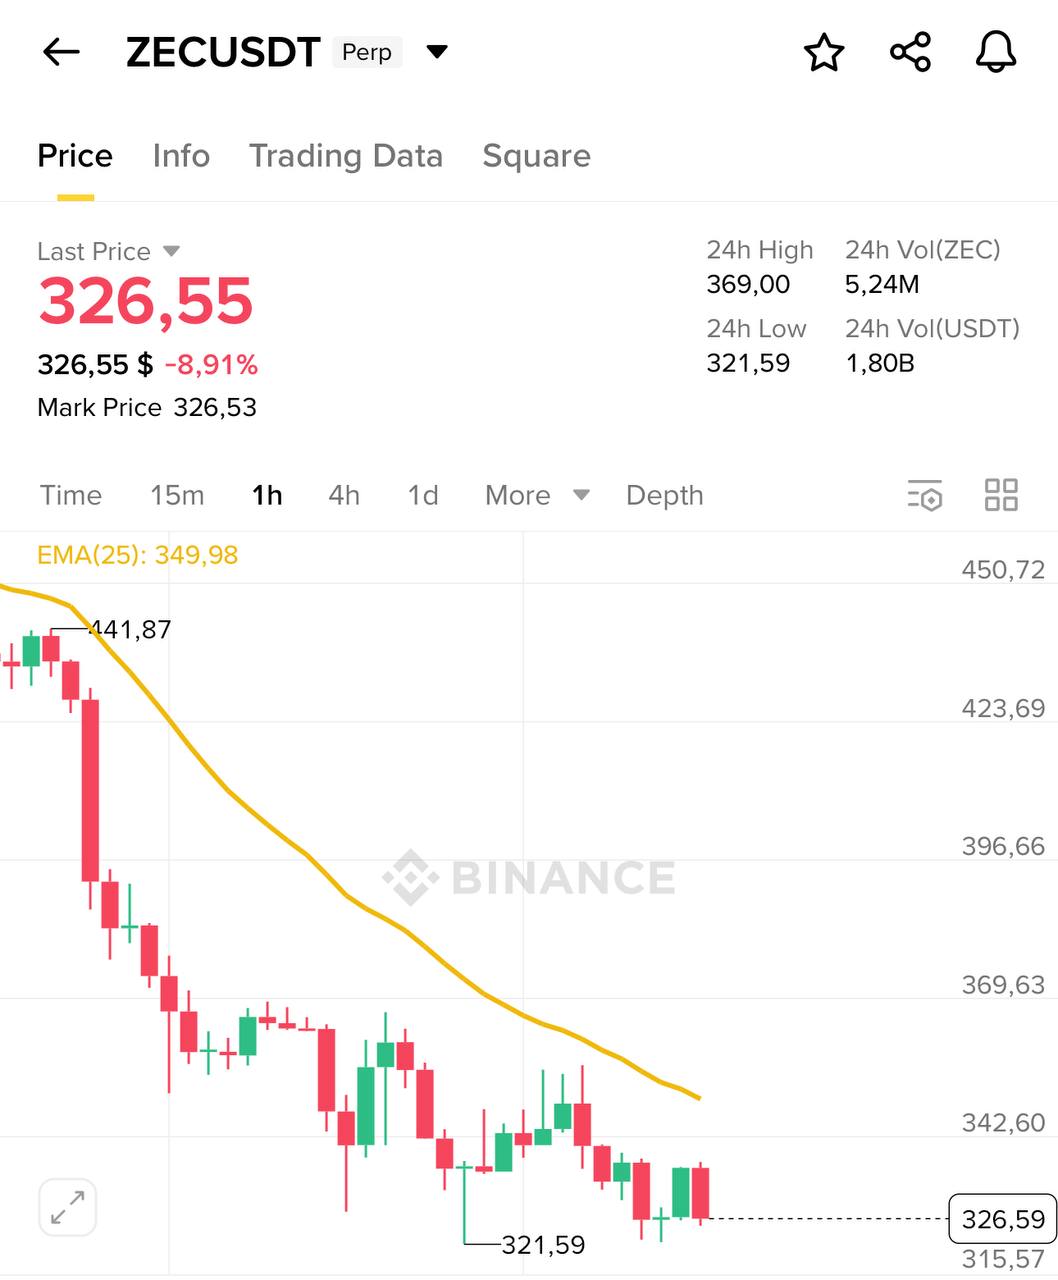
The image shows a cryptocurrency price chart with key levels, including the last price, low and high for the day, and an EMA line, indicating a bearish trend.
The image shows a cryptocurrency price chart with key levels, including the last price, low and high for the day, and an EMA line, indicating a bearish trend.
Leave a Reply